.svg "Pequity an adp company")

1. Select Your Salary Survey Cut
Compensation survey businesses collect data from participating companies (usually for a fee) and then aggregate and anonymize the data to sell back to the company.
FYI if looking for help, we have a compensation market data collaboration with Aon based on their best-in-class data practices. Pequity’s compensation consultants can also build or refresh your pay & equity ranges for you!
Salary surveys usually allow you to “cut” the data by company characteristics. These include but are not limited to:
- Employee count (1-10, 11-25, etc)
- Funds Raised ($5, $10-20, etc)
- Round Raised (Seed, A, B, C, etc)
- Industry (Commerce, Tech, Life Sciences, etc)
The more specific the cut, the less data you’ll get, but the more “accurate” for your industry. You may think a job is a job, and we should just pay a job what it’s worth — but there are different budget constraints for small vs large companies, and industries pay similar roles differently. For instance, it’s rational that a robotics company is likely to pay a mechatronics engineer more than a car mechanic. Yet some autonomous car companies will pay that car mechanic more just because of the space they operate in — confusing
The reason deeper cuts create a lack of data is the Sherman Antitrust Act. This law states:
“The U.S. Justice Department has published Antitrust Safety Zone guidelines on how employers can exchange salary data and information without running afoul of the law. Originally developed for the healthcare industry, these guidelines now apply to all employers and require the following conditions:
- Compensation surveys must be managed by a third party. HR professionals cannot conduct formal or informal salary surveys on their own.
- Data must be more than 3 months old.
- All of the salary data employers use must be derived from at least five entities, and no individual entity can represent more than 25 percent of the data.
Any information disseminated must be aggregated so recipients cannot identify the compensation paid by a particular organization.”
This law means that most surveys will only give you data if it meets the above criteria. It also means that all the “cuts” must meet the same criteria so surveys will only show data if:
- A least 5 companies are selected
- A role’s data will only show if 5 companies are selected and at least 5 employees are submitted to the role.
This means that any data cut, while filled with useful signals, are often filled with outliers and anomalies you need to counteract as a compensation professional. This is one reason why we refer to compensation as an “art and a science” — even with all the data in the world, because of how it’s cut and managed, you have to find ways to massage out the wonkiness in a fair and consistent manner. Which most experienced compensation professionals know how to do with the assistance of more data. More on that to come.
2. Salary Benchmarking & Job Leveling: Benchmark Your Roles & Job Levels
We now need to identify the roles & levels at our company.
Most surveys do not capture all the anomalies in the market in leveling, titling, etc. Microsoft for example has 30 job levels, and Google has 11, while many smaller startups have 4 job levels. So rather than try to have them free form submit, they ask companies to match their roles & levels to their surveys based on:
- Job content (technical skills)
- Reporting chain (who does this report to)
- Management requirements (do they have direct reports)
- Experience requirements (is there education or years of experience generally required)
- Scope of role (are they responsible for a single pixel or the entire application)
Using these, companies will evaluate their employees and “benchmark” or match them to the survey’s given level guides. This includes “benchmarking” future roles they want to hire.
Generally, best practice is to start by benchmarking employees into as specific but broad of a bucket as you can. For example, with most surveys you COULD benchmark your software engineers in to Mobile, Front-End, Security, Back-End etc, but generally, unless you are in a highly specific industry, you won’t find a huge difference in pay for these roles — so rather than make a range for all of these, I would suggest creating a single “Software Engineering” job family and choose the role that fits most the roles best. Over time you may find differences in the various software engineering roles that justify a pay difference, but it’s best not to overcomplicate, especially when you’re starting out.
Once I have the right job family chosen, I then choose the level. Surveys usually only have 6 individual contributor (or IC) levels, and 6 management levels, and they all contain details on the typical years experience, education, scope and impact of this level. Using this guide, I will match my company’s leveling system to the survey levels. As there are only 6 for both the IC and Management, it’s not uncommon for higher level roles to be pushed or split into multiple upper levels, while the lower-level or “entry” roles are fairly easy to identify. It’s worth noting that while you may benchmark your levels to the survey, you’ll eventually have to benchmark your employees to those levels too – more on that to come.
Once we are benchmarked to a role and level (in this exercise we’re assuming you have one location, but if you have multiple you’ll need to map to the right location too) we are ready to find our target market percentiles.
3. Isolate Your Market Targets
At this stage we have all the compensation data we need and have benchmarked our roles to the survey. We have our compensation survey, and are looking to make some basic salary and equity ranges.
From here there are several paths we can take. There are numerous best practices to create salary ranges but we first need to isolate our “target” or “Market Reference Point” (MRP). This target is where we want the majority of our workers in that role & level to be paid. Most companies’ finance teams will forecast their headcount budget at the given target or MRP, so this usually becomes the midpoint of our ranges.
To isolate, you will need to select a percentile (%tile). Typically, even if you’ve never seen a market data survey, you are already paying people against a %tile, so you could take your employee’s pay and compare it to the survey. This would give you an idea of where you are currently paying. However, choosing a target %tile is a strategic decision, as the %tile chosen will help you with hiring against your competitors. The general way compensation professionals think of the various %tiles is as follows:
- < 50th %tile: “Following the market”
- You are below the average market pay
- This is most typical for young companies, or less competitive roles
- Still has to abide by local minimum wage
- 50th %tile: “At market”
- You are paying exactly what the market says is fair
- This is typical for most companies
- Usually G&A or “non-competitive” roles are paid 50th
- >75th %tile: “Leading the market”
- You are above what is the fair market rate
- This is typical for highly competitive roles, such as tech companies to pay their software engineers
- Usually roles with scarcity in the market are paid at or above P75
- >=90th %tile: “Top of market”
- You are at the market maximum
- This is very rare as a practice, as 90th is usually filled with outliers in the data
- Google pays most roles at the 90th for total compensation
- This would be for your most critical, hard to hire talent
Once you choose your MRP (which you’ll need to do for salary and equity, or for total compensation which you can use to back into salary & equity) you will need to pull the value for that %tile for each compensation element from your data. Once you have that, you are able to take all the jigsaw pieces that other companies sent to create your compensation picture.
Depending on what you choose to target – total cash, total direct compensation, salary + equity, etc – you’ll need to figure out how to back into your other pay elements. If you sum ALL the pay elements across a survey – so salary + annual equity + annual bonus (STI) it will inflate your ranges because of the way market data is amassed. This means a best practice is to choose one or two pay elements to target, and back into your other compensation practices from there. Below are some examples of how to target and back-into the other forms of compensation.
| To Calculate…. | Example Calculations |
| Salary | Take the amount directly from survey salary fieldSubtract your LTI + STI from Total CompSubtract your STI from Total Cash |
| Equity | Take the amount directly from survey long term incentive (LTI) fieldSubtract your Salary + STI from Total CompSubtract Total Cash from Total CompMake a % of your Total CompMake a % of your Salary |
| Bonus | Take the amount directly from survey short term incentive STI fieldSubtract your Salary + LTI from Total CompSubtract Salary from Total CashMake a % of your Total CompMake a % of your Salary |
| Total Compensation | Take the amount directly from survey total compensation fieldSum up Salary + LTi + STISum LTI + Total Cash |
None of these calculations are technically wrong, but they all have pros and cons. Because of the data’s cuts and acquiring methods, there’s so many ways to interpret it.
Generally, I suggest companies either take the exact %tile they want to target for 2 elements max (so P50 for salary and P50 for LTI) OR I suggest they take the target total compensation, and subtract target based pay from that to find the remainder which will go to LTI & STI.
4. Now, “Smooth” The Progression
Once you have your %tile targets chosen, we need to extract that data and we need to smooth out the difference between each level and role. This is necessary because you need to have logical progression from level to level as an employee is promoted or moved up, and since market data is a statistical survey, you’ll often find the gaps are very narrow or overly broad. This is called compression.
For instance, you may find the following in your data
| Level 1 | Level 2 | Level 3 | Level 4 | |
| P50 MRP Salary | $92,000 | $114,550 | $116,900 | $151,220 |
You’ll notice that there’s “compression” between levels 2 & 3 (very common) and a lot of space between the others. This would be weird if you used these to form ranges, because this would make your midpoints between an L2 & L3 very close, so if someone was promoted they may only get a $2k increase. To fix, we’d aim for:
- 12-20% progression between MRPs
- An MRP ½ way between the MRP above and below it
So what we’d do is manually adjust the midpoints (and round them, because why would we want to have such weird numbers?) to something like the following:
| Level 1 | Level 2 | Level 3 | Level 4 | |
| P50 MRP Salary | $90,000 | $110,000 | $125,000 | $150,000 |
All I did here was take 5k away from Level 2, and add 7k to Level 3. This creates enough reasonable space that a promotion would get a significant bump. It’s worth noting that Pequity has an algorithm that can smooth data like this in minutes, developed over years of creating ranges.
This is the exercise I would run on my salary & equity amounts. You often don’t need to do this for STI (bonus) as that is usually a % of base. If you also aren’t targeting total compensation directly, you can just add up your own salary + equity + STI to create your company total compensation (which may differ from the market total compensation because of the smoothing and rounding you perform).
5. Calculate Your Salary Range Lows & Highs
Once you have your MRPs chosen, you need to create actual ranges, with a range minimum and a maximum. This is done by assessing what you want your lows and highs to be.
If you have wider ranges, there’s more overlap. This can be good or bad, depending on your goals. Overlapping ranges means someone can remain in their role longer with potential for increasing pay, without needing a promotion. No overlap means you have to eventually be promoted to get to the next level pay, which can create internal pressure for more senior roles where they are more likely to be “terminal” or unable to move up with becoming a leader.
Generally, a good range is ~20% for salary and equity. I like to do 20% for salary (up and down) and 25% for equity (up and down). Reason being that equity is harder to negotiate because you don’t always have a concrete idea of value, whereas salary is very specific and most negotiable.
6. Compare To Employees & Iterate
Now, we have our ranges created, we need to stress test if this actually works for our employees. How you would do this, is pull up the employees you benchmarked, and compare them and their pay to their new ranges.
This exercise is what we refer to as “sore thumbing.” It’s important to note that the market data and ranges could be exactly correct, but that your leveling is incorrect internally, or that someone is underpaid/overpaid. This is where you loop in HRBPs and begin to really form up your philosophy. I often warn leaders that sore thumbing typically requires performance intervention, and should be paired up with a compensation cycle of some sort.
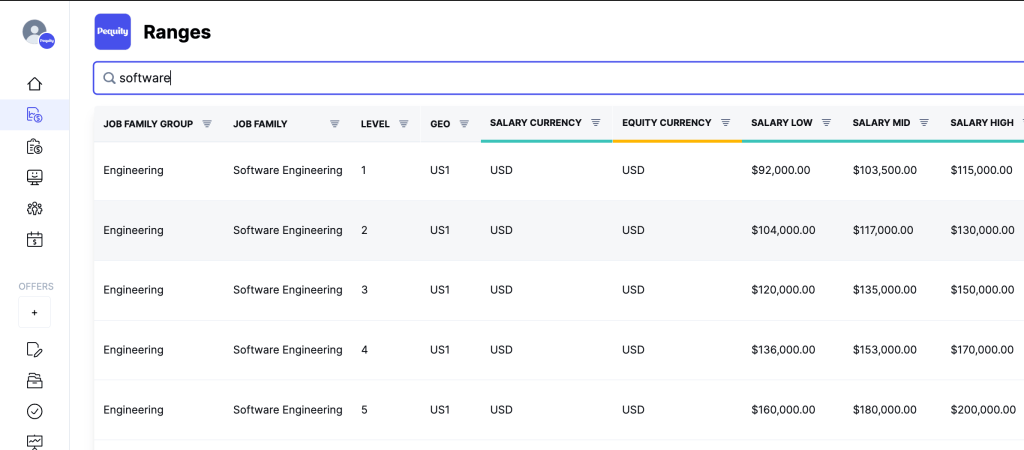
7.Create & Share Your Salary Bands In Pequity
Now that your ranges are created, you need a way to share your organization’s pay bands in a secure & efficient manner with strong permissions. Most companies lean on spreadsheets, but there is usually a lot of maintenance and risk with these. This is why we created Pequity Ranges to help you create and share range / pay band data internally, in a way that’s secure, efficient, and scalable. Easily share pay ranges with recruiters down to their specified target job level, geo, role, etc. Our salary range software is fully customizable – meaning each column can be set up to your specific naming conventions, color codes, currency, or cryptocurrency! Additionally, you can export your ranges, search, & filter on the fly to find what you need when you need it. Better yet, all of your range data flows into our compensation cycle software and offer letter software, so all of your compensation decisions can finally live in one operating system.
Need help building your orgs pay bands? Talk to a Pequity Compensation Expert.